Results
How to read this page
Section titled “How to read this page”Each figure answers one question and states the conditions it holds under: budgets (evaluations per dimension), dimensions, instance ids, seeds, competitor versions and the commit. The curves and the cell map follow the COCO convention: the measure is the fraction of (function, target) pairs reached, with 51 targets from 10² down to 10⁻⁸, functions weighted equally. Dimensions are never pooled, because dimension is a fact of your problem that you can use to choose an algorithm.
Final test (ids 101-110)
Section titled “Final test (ids 101-110)”1. Share of targets reached, per dimension
Section titled “1. Share of targets reached, per dimension”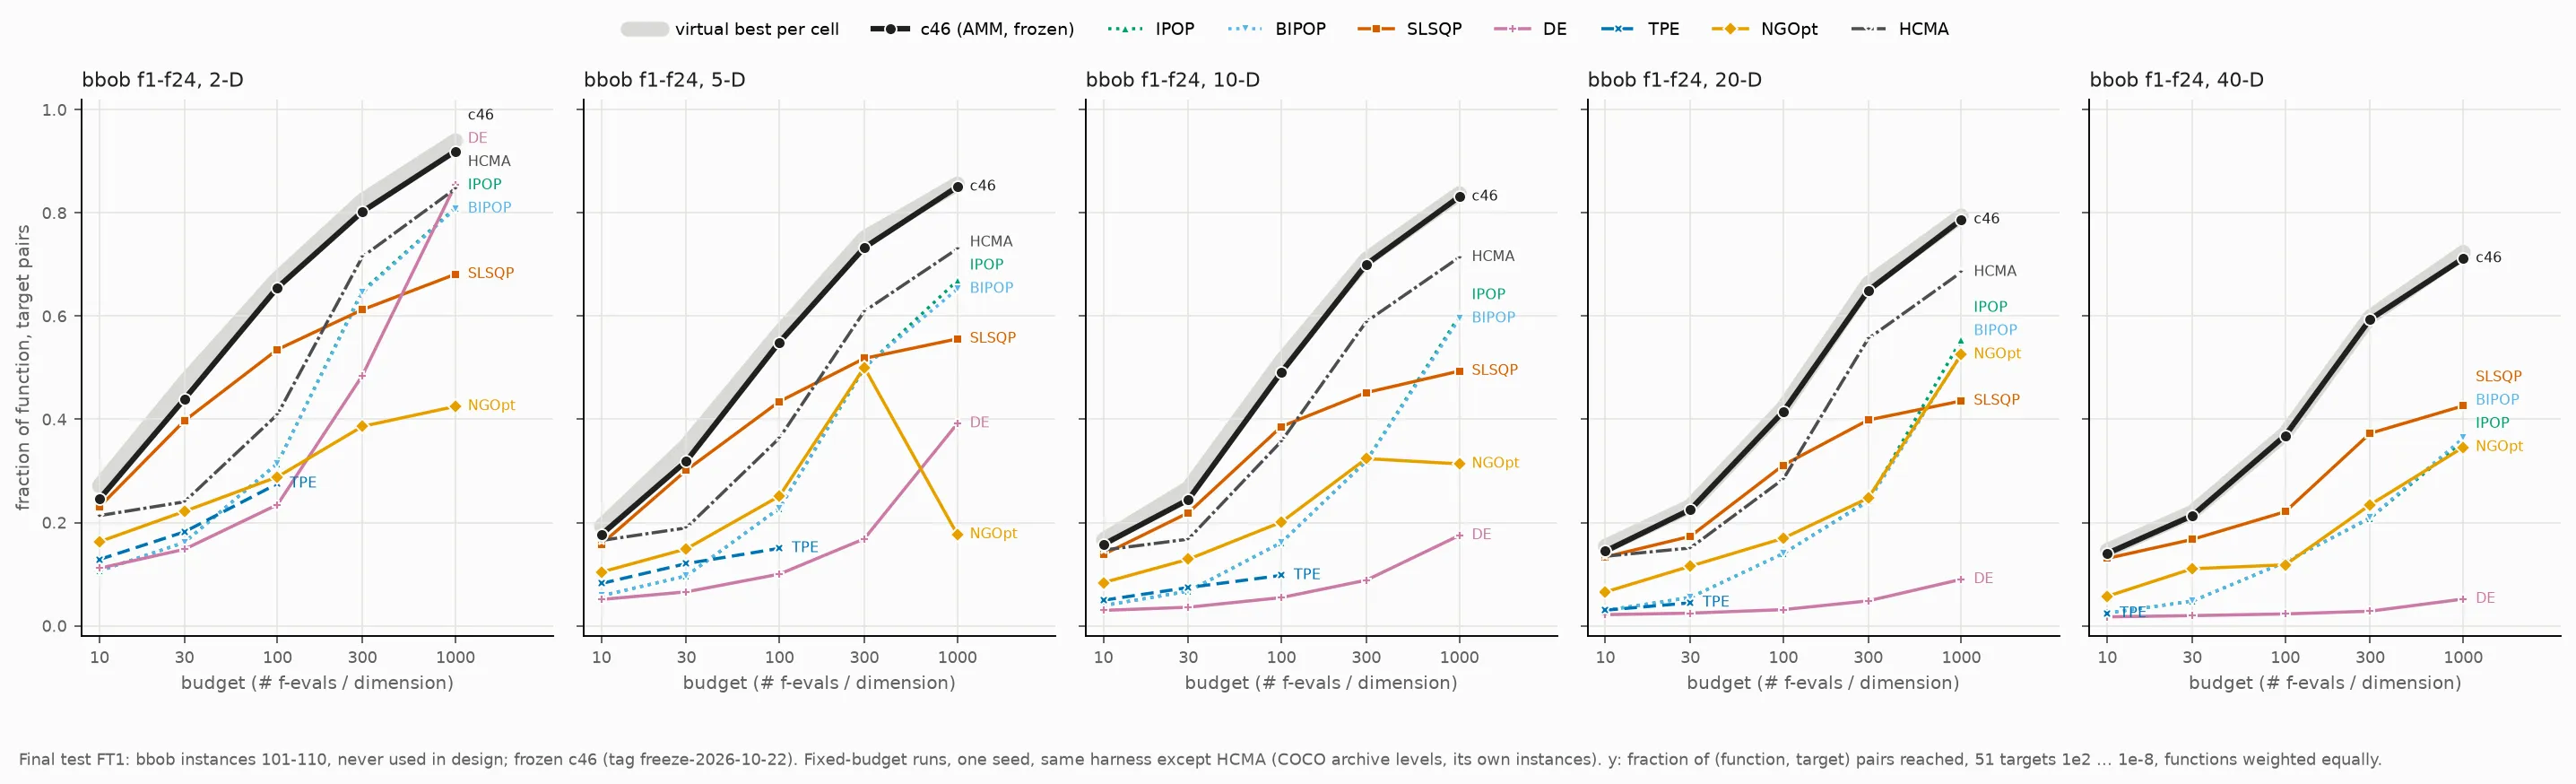
Reproduce this figure
- command
- final_ft1.py with no arguments, and ft1_plots.py as run for v2 (batch b095_final_ft1)
- seed
- 9000, one run per function, dimension, instance and budget (6,000 runs of AMM)
- instance ids
- 101-110, never used by any design decision
- budgets
- 10, 30, 100, 300, 1000 x D
- commit
- frozen configuration c46, config hash 2153948ebed51150 (tagged history in the research archive)
- competitors
- pycma IPOP/BIPOP, SLSQP, DE, TPE (capped slice) and NGOpt in the same harness; HCMA from the COCO archive
- hardware
- pending: filled from the run manifest
- cost
- pending: filled from the run manifest
2. The preregistered comparisons: AMM against IPOP and against SLSQP
Section titled “2. The preregistered comparisons: AMM against IPOP and against SLSQP”Before any final-test run, the comparisons and the ranges they should fall in were written down. Each number is the mean over 120 (function, dimension) cells of AMM’s share of targets minus the competitor’s, with a 95% bootstrap interval over cells (2,000 resamples) and a Holm correction over the five budgets. Every budget is above zero for both comparisons.
| Budget | AMM minus IPOP (F1) | Predicted | AMM minus SLSQP (F4) | Predicted |
|---|---|---|---|---|
| 10 x D | +.121 [+.080, +.168] | +.06 to +.17 | +.015 [+.007, +.022] | −.01 to +.03 |
| 30 x D | +.203 [+.153, +.254] | +.12 to +.25 | +.037 [+.020, +.053] | .00 to +.05 |
| 100 x D | +.303 [+.244, +.361] | +.20 to +.36 | +.118 [+.085, +.156] | +.05 to +.15 |
| 300 x D | +.312 [+.251, +.375] | +.20 to +.36 | +.225 [+.183, +.276] | +.13 to +.27 |
| 1000 x D | +.222 [+.170, +.280] | +.12 to +.27 | +.302 [+.246, +.362] | +.20 to +.35 |
All ten results fell inside the predicted ranges, and so did the two cell counts below: every preregistered prediction of the final test held. The lead over SLSQP is small at small budgets, where a quasi-Newton method is hard to beat on smooth functions, and grows with the budget.
3. Cell by cell: where AMM leads and where it trails
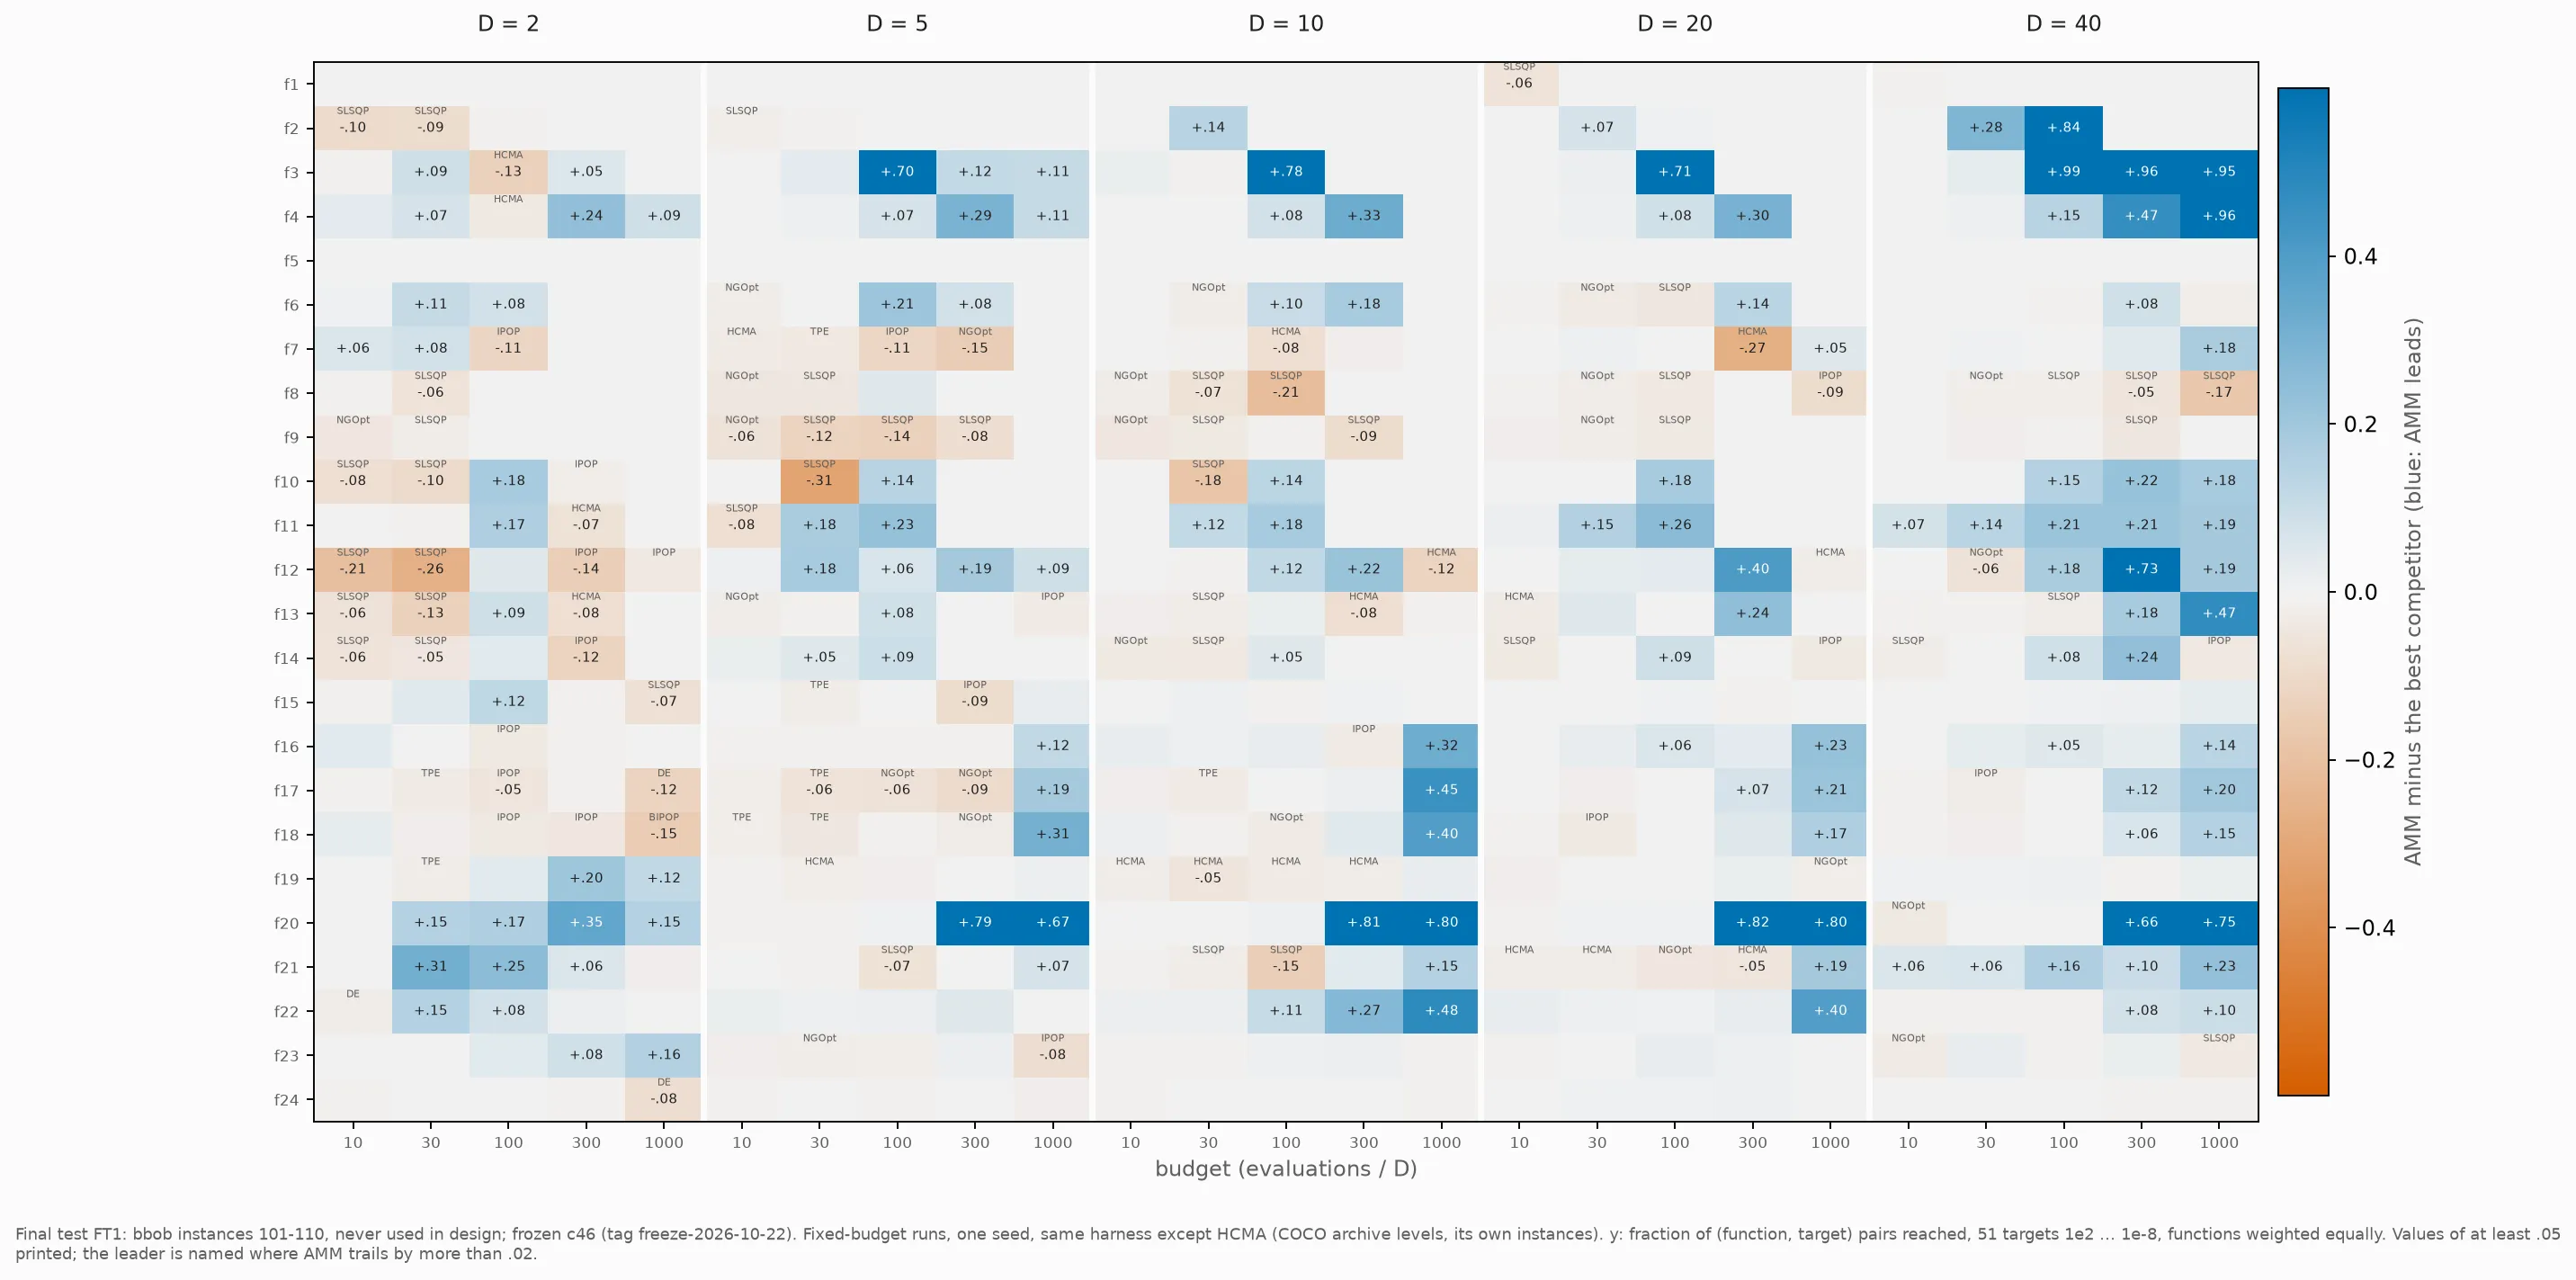
Section titled “3. Cell by cell: where AMM leads and where it trails”Each cell is one function at one dimension and budget. Blue means AMM leads the best competitor in that cell by more than 0.02; orange means it trails by more than 0.02, with the leader named. Cells within 0.02 are pale. This is a descriptive plotting rule on the mean over the ten instances, not a significance test, and it is not the “credibly behind” rule used for the counts below, so the map shows more orange cells than the 35 that the preregistered rule counts.
Reproduce this figure
- command
- ft1_plots.py, as run for v2
- seed
- 9000
- instance ids
- 101-110
- budgets
- 10, 30, 100, 300, 1000 x D
- commit
- frozen configuration c46, config hash 2153948ebed51150 (tagged history in the research archive)
- competitors
- best of pycma IPOP/BIPOP, SLSQP, DE, TPE, NGOpt in the same harness, and HCMA (archive)
- hardware
- pending: filled from the run manifest
- cost
- pending: filled from the run manifest
The preregistered counts use a stricter, probabilistic rule: a cell counts as credibly behind when some competitor leads by more than .02 with posterior probability above .9 over the ten paired runs, and as credibly ahead when AMM does so against every competitor that ran the cell.
The preregistered ranges were 30 to 75 cells credibly behind and 70 to 120 credibly ahead of all. Both results fell inside their ranges. The cell-level intervals are about 25% too narrow, so these are counts and not statements of significance. Every one of the 35 cells where AMM is credibly behind is listed, with the competitor that leads, on the limits page. The research log records how the analysis was run.
Where AMM has the highest mean, per budget (cells out of 120, ties included):
| Budget | 10 x D | 30 x D | 100 x D | 300 x D | 1000 x D |
|---|---|---|---|---|---|
| AMM | 57 | 61 | 79 | 90 | 95 |
Against HCMA’s archive levels (which are on other instances, D 2 to 20, 96 cells per budget), AMM’s share of targets minus HCMA’s is +.016, +.120, +.174, +.104 and +.103 at 10, 30, 100, 300 and 1000 times the dimension. The margin at 10 x D is small, so read the lead as holding from 30 x D.
Development context (in-sample, ids 61-70)
Section titled “Development context (in-sample, ids 61-70)”These figures come from instances used while AMM was being built. They are not held out and are shown because they were the basis for the final-test predictions; the final-test numbers above were within about .01 of them for the per-budget comparisons.
4. Share of targets reached, per dimension
Section titled “4. Share of targets reached, per dimension”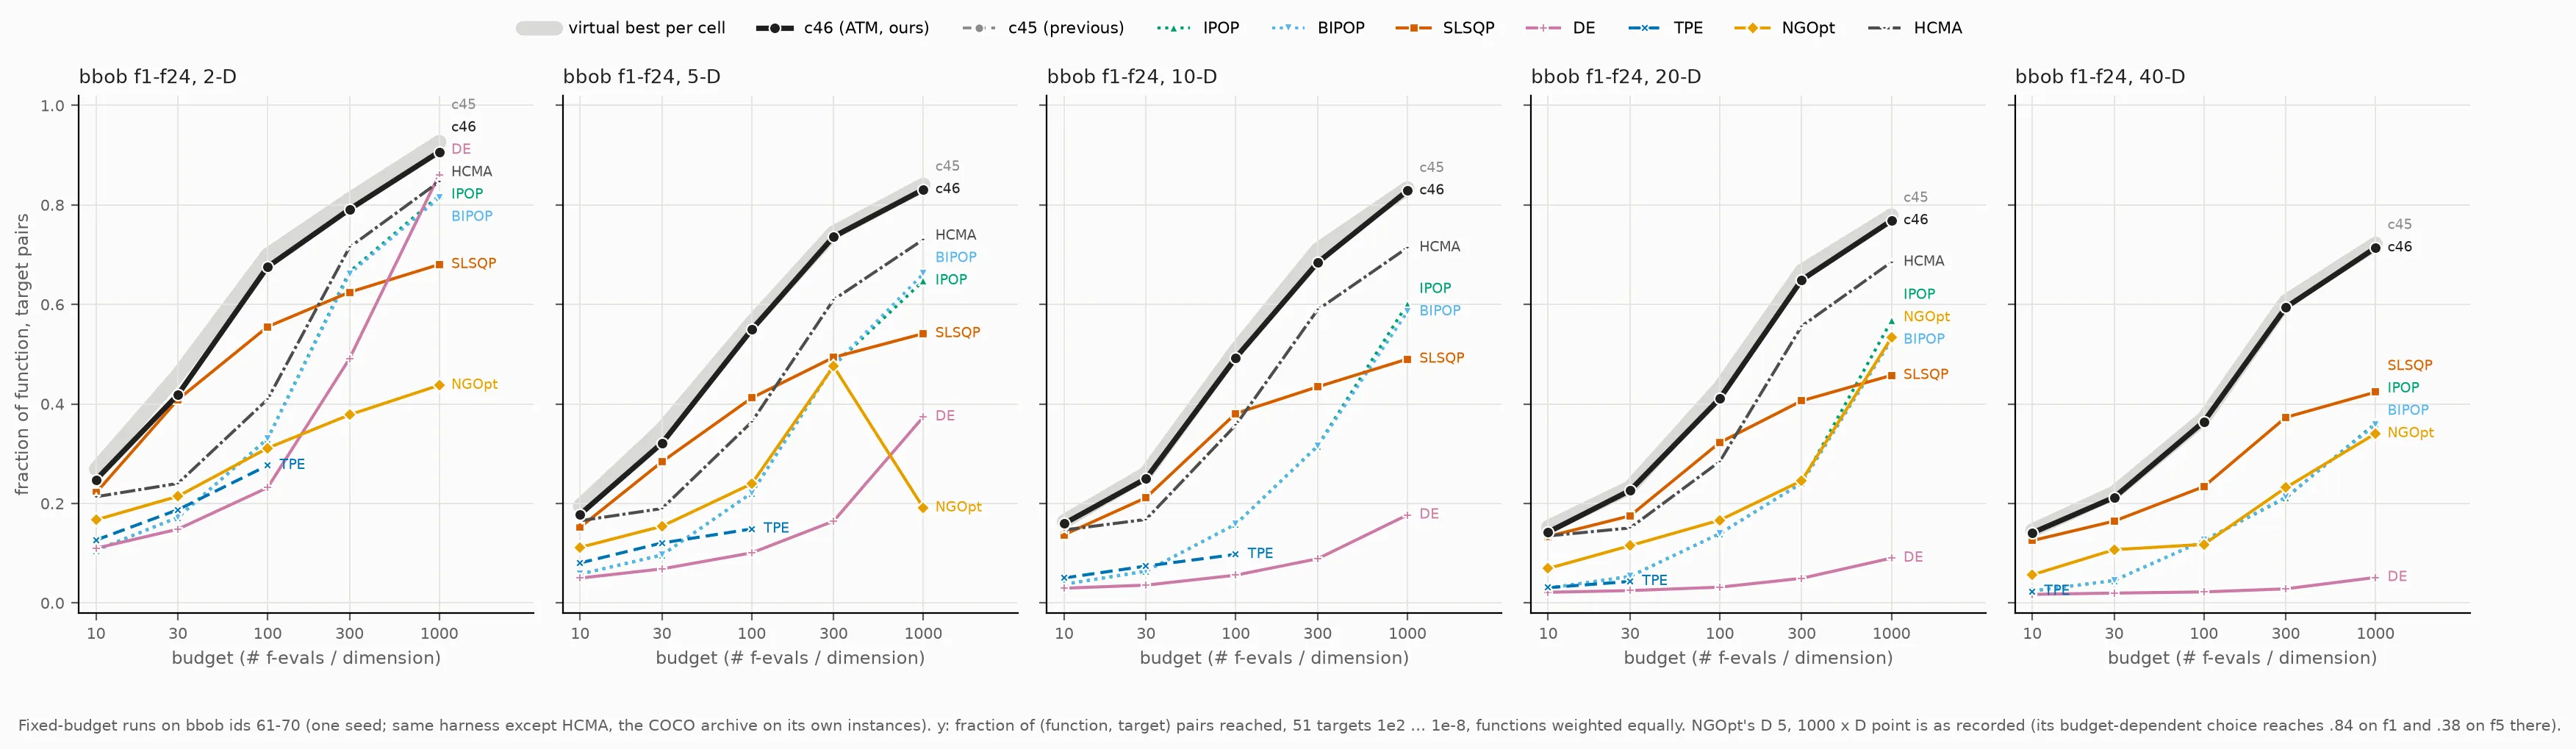
Reproduce this figure
- command
- pending: filled from the run manifest
- seed
- one seed per run
- instance ids
- 61-70 (in-sample)
- budgets
- 10, 30, 100, 300, 1000 x D
- commit
- frozen configuration c46, config hash 2153948ebed51150 (tagged history in the research archive); the in-sample runs were made by development commits (c45 for 528 of 600 cells), see Reproduce
- competitors
- pycma IPOP/BIPOP, SLSQP, DE, TPE, NGOpt run in the same harness; HCMA from the COCO archive
- hardware
- pending: filled from the run manifest
- cost
- pending: filled from the run manifest
5. Cell by cell (development)
Section titled “5. Cell by cell (development)”With the same descriptive rule as the final-test cell map (more than 0.02 apart), the development comparison has:
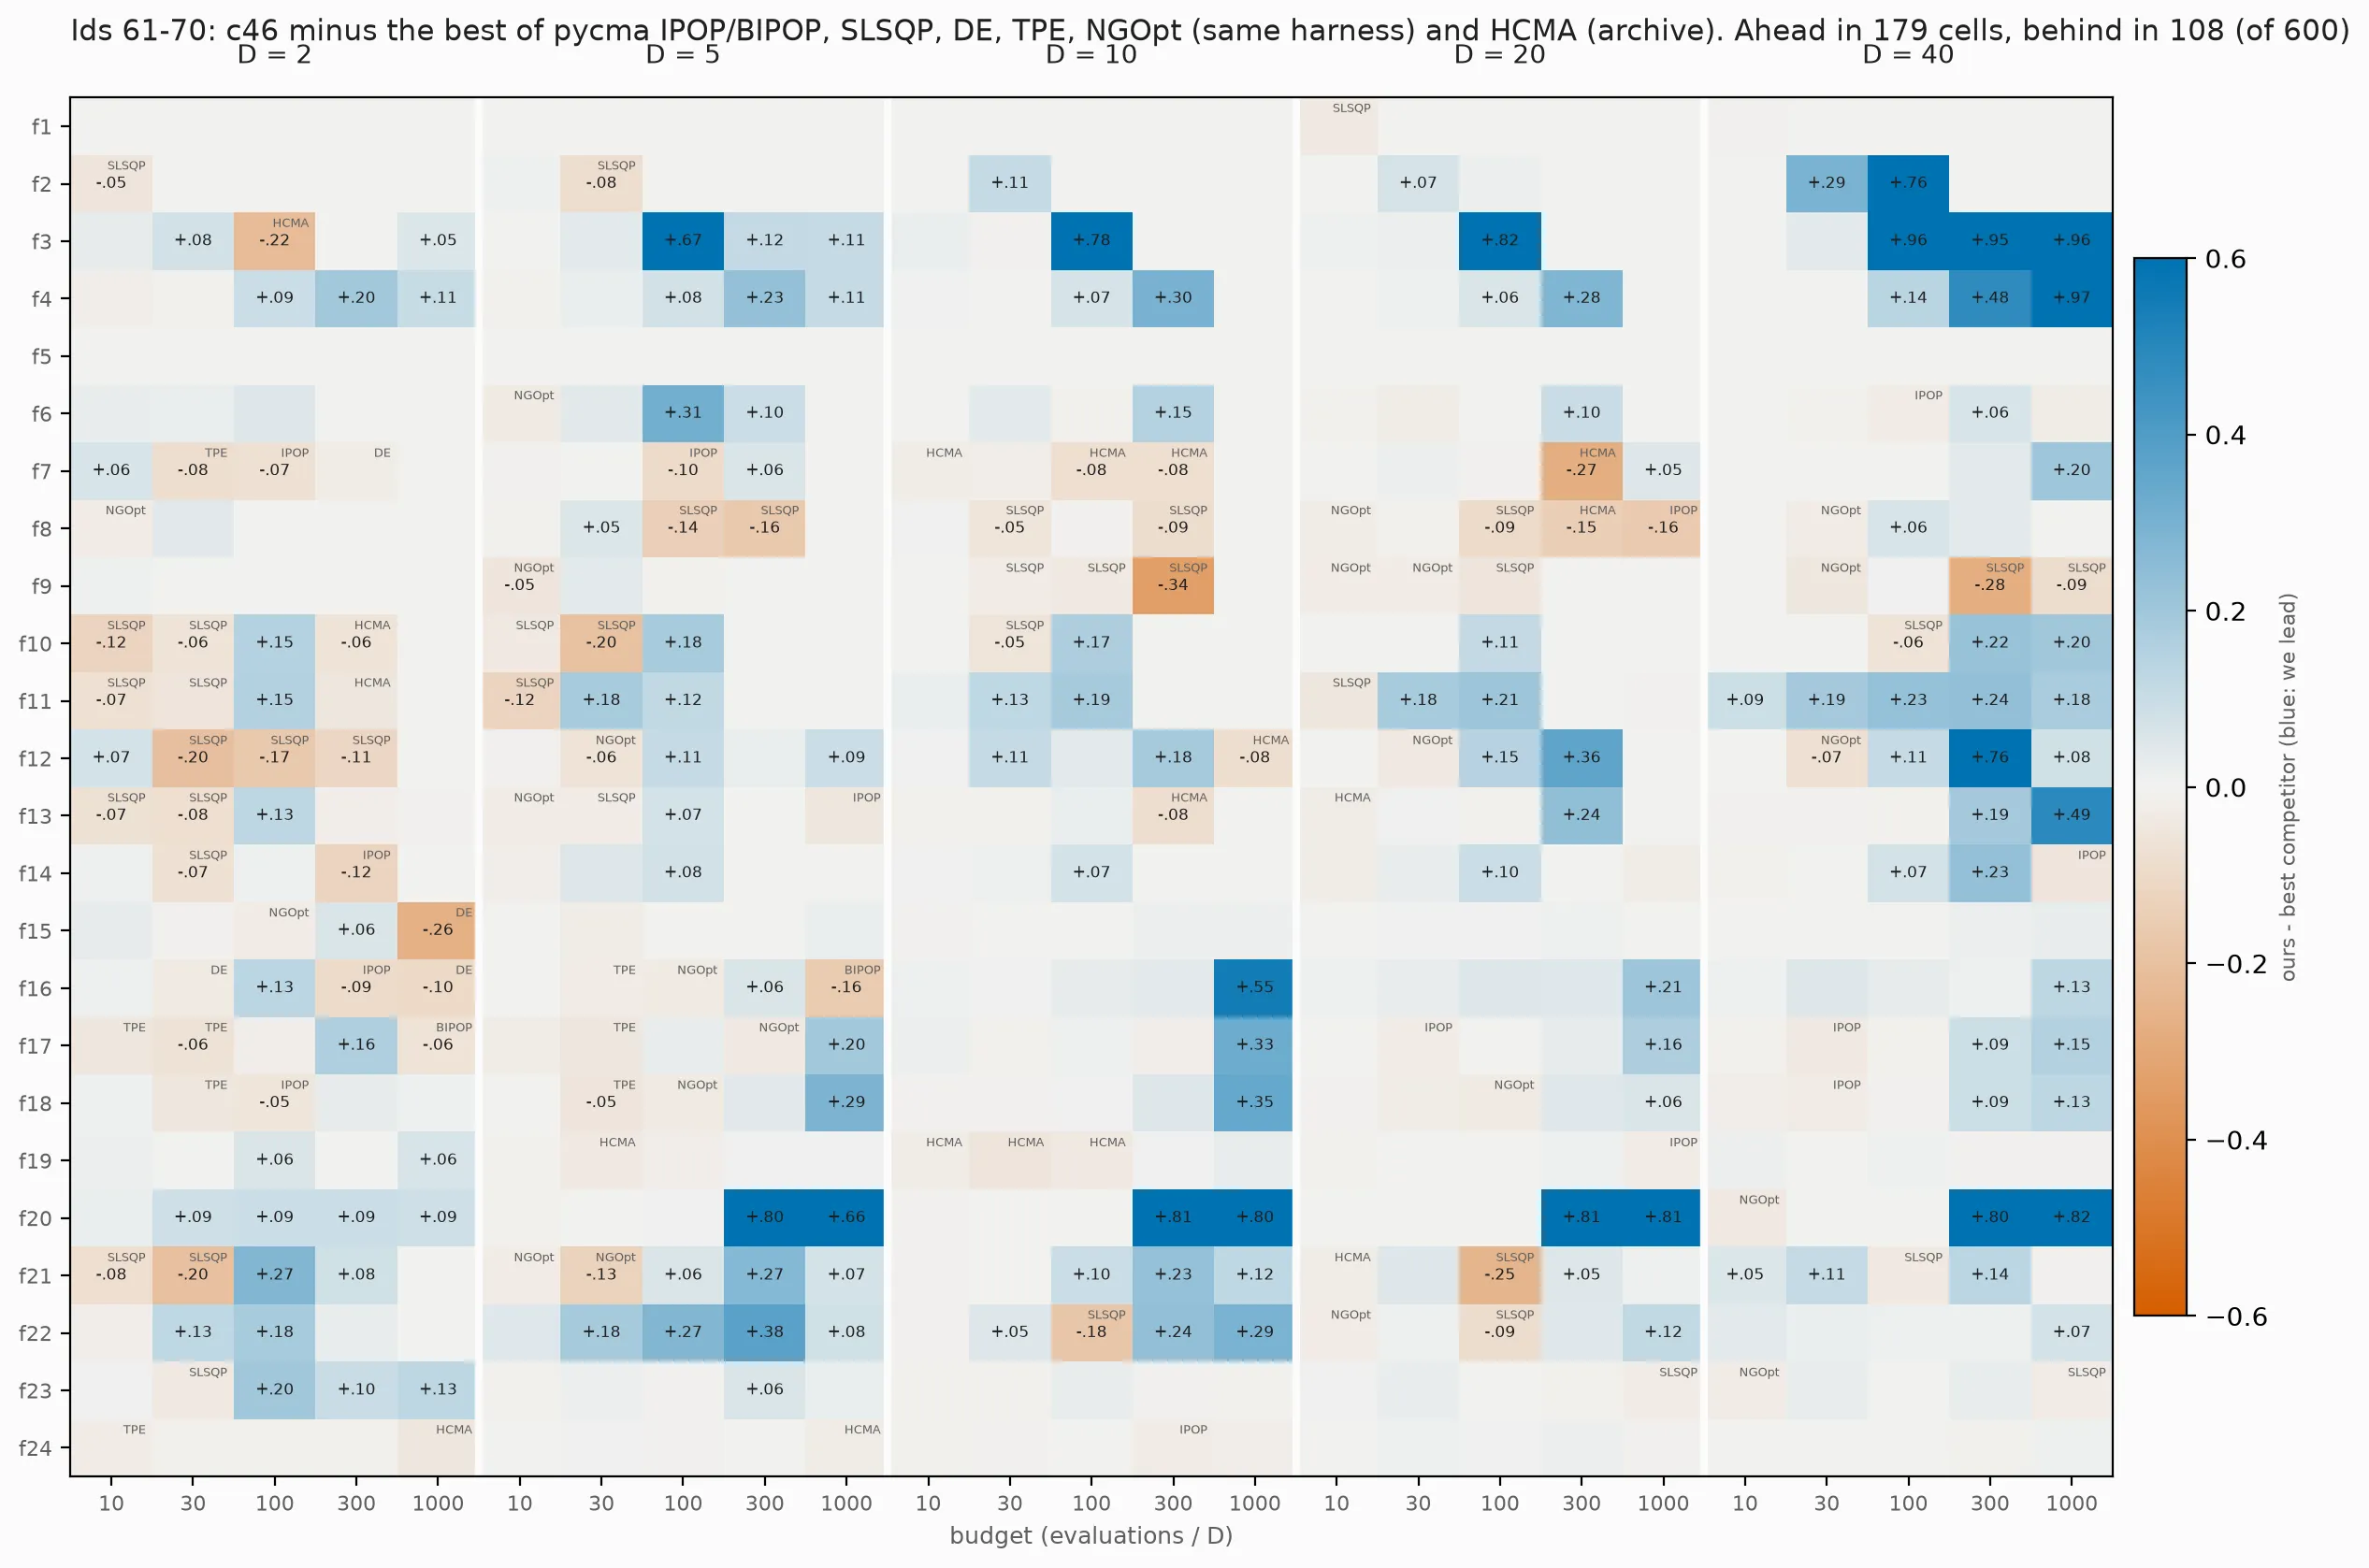
Reproduce this figure
- command
- pending: filled from the run manifest
- seed
- pending: filled from the run manifest
- instance ids
- 61-70 (in-sample)
- budgets
- 10, 30, 100, 300, 1000 x D
- commit
- frozen configuration c46, config hash 2153948ebed51150 (tagged history in the research archive); the in-sample runs were made by development commits (c45 for 528 of 600 cells), see Reproduce
- competitors
- best of pycma IPOP/BIPOP, SLSQP, DE, TPE, NGOpt (same harness) and HCMA (archive)
- hardware
- pending: filled from the run manifest
- cost
- pending: filled from the run manifest
6. By function group (development)
Section titled “6. By function group (development)”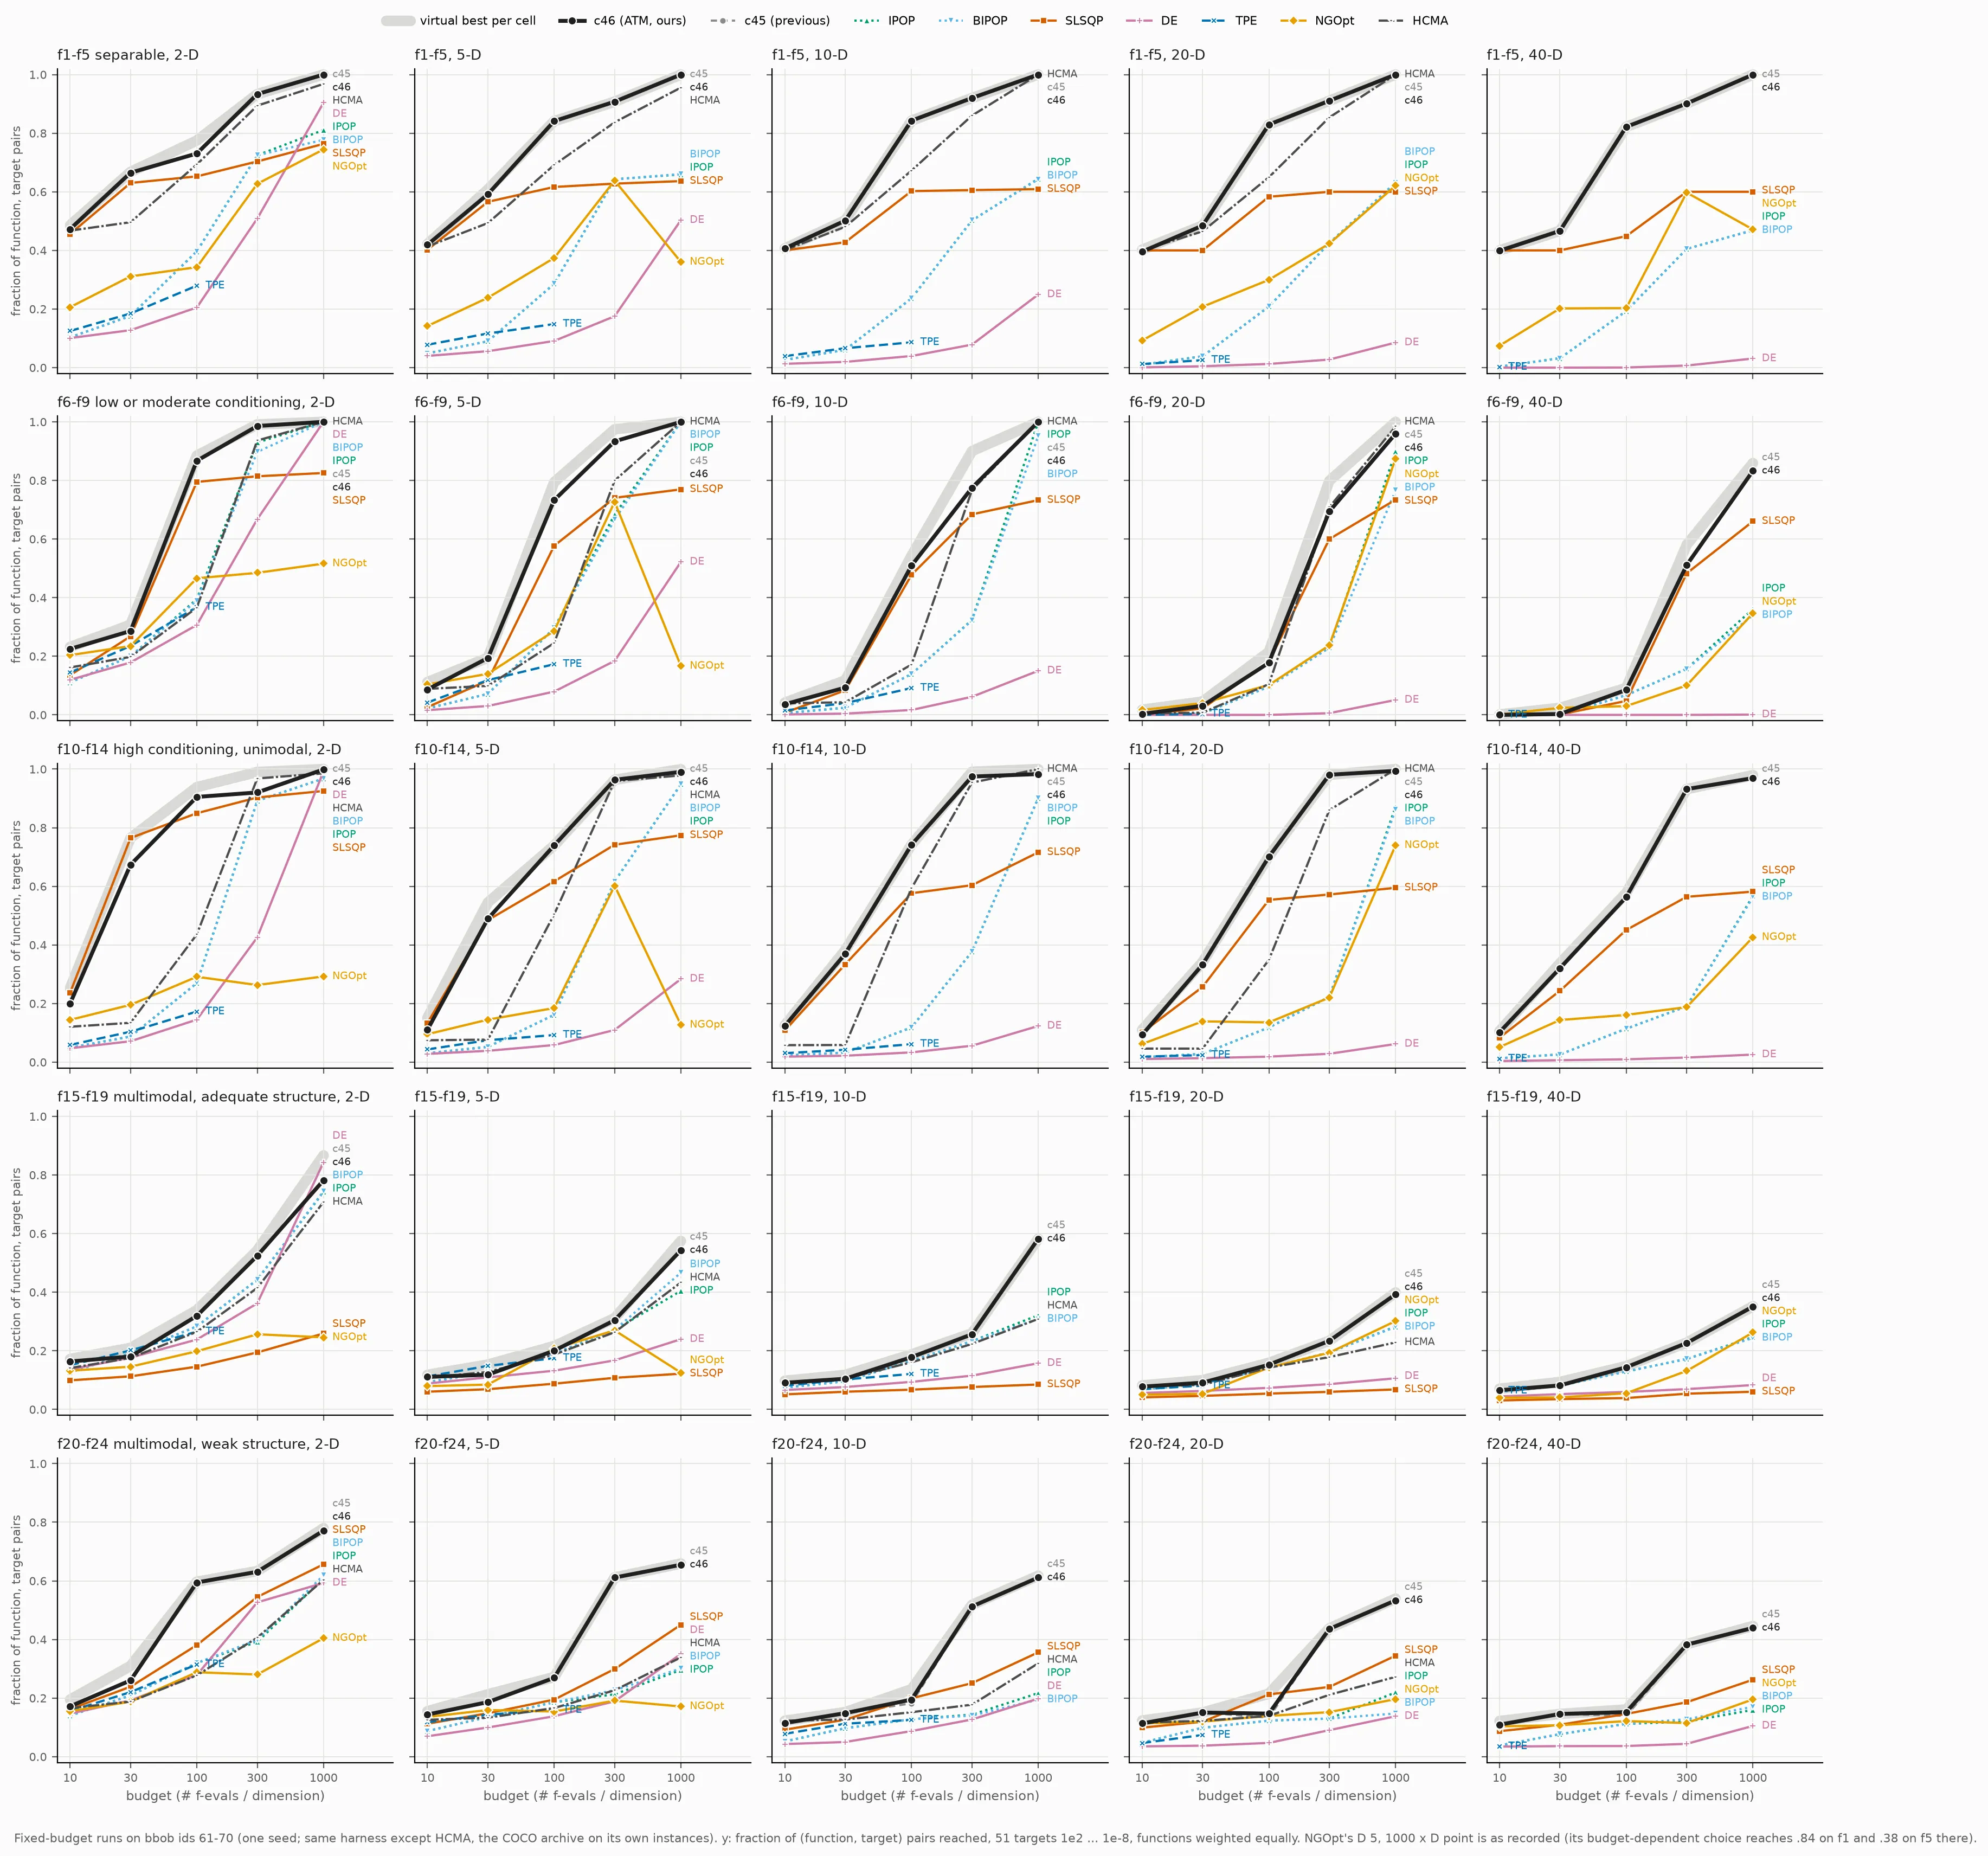
Reproduce this figure
- command
- pending: filled from the run manifest
- seed
- pending: filled from the run manifest
- instance ids
- 61-70 (in-sample)
- budgets
- pending: filled from the run manifest
- commit
- development commits, see Reproduce
- competitors
- pending: filled from the run manifest
- hardware
- pending: filled from the run manifest
- cost
- pending: filled from the run manifest
What to know about this data
Section titled “What to know about this data”- Final test: one seed per (function, dimension, instance, budget), ten instances per cell. HCMA is archive data on other instances and exists for D 2 to 20 only; TPE ran a capped slice of the grid; NGOpt ran at every dimension. Where a competitor is missing (HCMA at D 40, most of TPE), the best competitor is the best of the others, so those cells are easier to win than a full comparison would be.
- Development data: one seed per instance, ten instances. The AMM series is a composite: 528 of the 600 cells come from the full-grid run of the previous configuration c45, and 72 cells (D 10, 20 and 40 at 100 x D) from the literal frozen configuration c46, which differs from c45 by one parameter from D = 10.
- Package versions recorded for the development runs: Python 3.12.10, NumPy 2.5.4, SciPy 1.18.1, pycma 4.5.0, cocoex 2.8.2. The Optuna and Nevergrad versions and the hardware were not recorded for these runs.
What this page does not show yet
Section titled “What this page does not show yet”- Intervals on the curves. Bootstrap intervals over instances for every ECDF curve.
- Problems beyond bbob: not yet testedpending.
- Wall-clock cost per evaluation and run-to-run seed variance (see the limits page).
- Raw data downloads: one CSV per figure with a manifest of hashes, generated with the final run.